To the engineer falls the job of clothing the bare bones of science with life, comfort, and hope.
– Herbert Hoover
The following is an excerpt from the Thesis of Dr. Anthony Portelli. The entire thesis will be made available for download when possible.
Bio-potentials exist as the differences in electro-motive force present between living cells, tissues, organelles, organisms and their interactions and thus changes through time. Within living organisms, bio-potentials are exhibited in relation to most biological processes, as a result of interactions consisting of ionic charge transfers between, or through, electrically active cells.
Electrocardiography (ECG or EKG “Kardia” from the Greek meaning heart) is the name given to the observation and analysis of the amplified electrical activity of the heart via electrodes placed (normally thoracically, across the chest) on the surface of the skin. This non-invasive procedure is usually undertaken for clinical diagnosis, estimation of fitness (i.e. identification of Aerobic and Anaerobic heart rates zones) and recovery times. The observable ECG stems from potential oscillations detected, on the skin, as a result of the depolarisation of specific heart muscles. During normal sinus rhythm the stereotypical waveform is observed. Due to the magnitude of ECG potentials (up to 100mV un-amplified amplitude) they can be recorded from almost any point on the body.
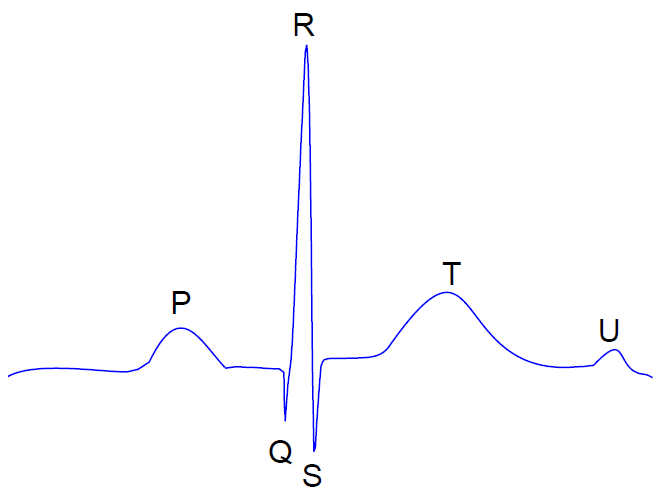
P, Q, R, S, T, U denote six distinct elements that are typically present in the expected beating of the heart during normal sinus rhythm. These appear in alphabetical order and are exhibited as shown above. Heart-rate measurement is undertaken by calculating the distance between R peaks in the ECG. This is known as the R-R interval. While there is a wide range of deviations from the idealized PQRSTU waves, anything significantly different can provide insight into issues stemming from a variety of structural abnormalities and medical issues. Thus, the detection of the ECG is a useful tool for the diagnosis of heart conditions, for example paroxysmal tachycardia and arrhythmia.
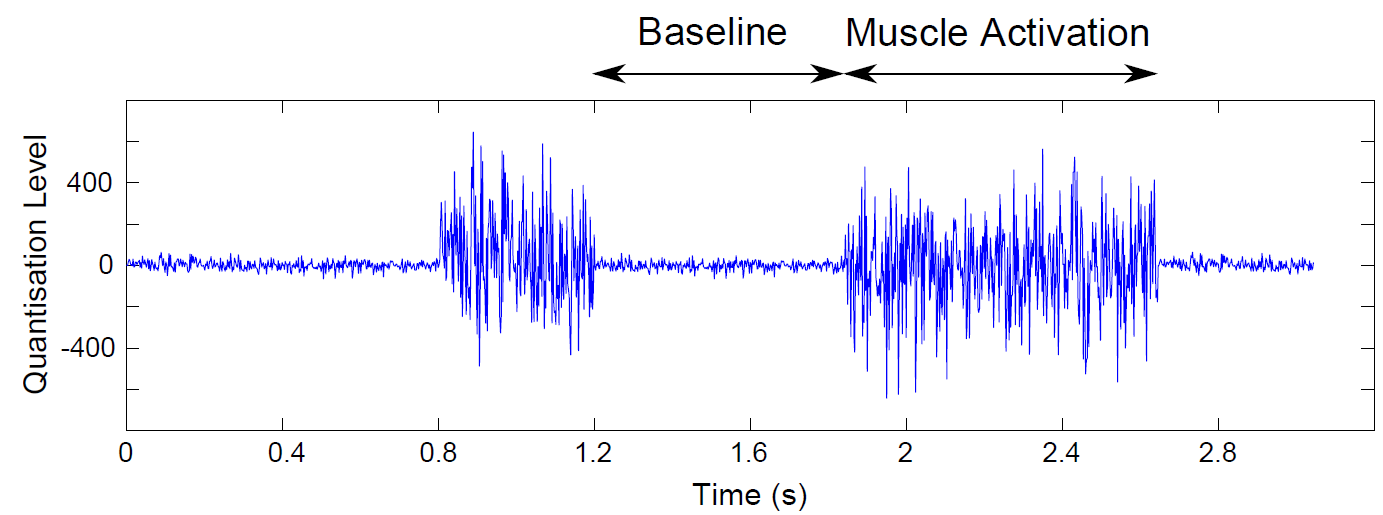
Electromyography (EMG) recordings, bio-potentials detected as a result of muscular activity, are used in a variety of research areas requiring measurement of muscular performance, analysis to improve sports activities or detection of muscle responses in ergonomic studies.
EMG signals generated during muscular contractions, are a reflection of the summation of activity representing electrical potential activity of a group of motor units. A motor unit is defined as a motor neuron as well as all of the muscle fibres it is connected to. These innervated muscle fibres elicit their own action potentials when the action potential from the motor neuron crosses the neuromuscular junction. The signal generated is smaller than that of ECG 1mV but varies in amplitude depending on the size of the muscle being activated.
EMG signal activity is generally considered to be within the range of 0-500Hz and so is of a higher frequency than other surface detected bio-potentials. Nevertheless the useful components of the EMG signal are said to be within the 50-150Hz range meaning that they are often detected by other amplification equipment. Due to the quasi-random nature of motor unit firing the EMG signals detected between 1-20Hz are unstable.
Electrooculography (EOG) is the acquisition of the electrical signal corresponding to the resting potential of the eye and retina. EOG signals are used as a method of ophthalmological diagnosis, and eye position monitoring. A voltage gradient exists between the front and the back of the eyeball. As the position of the eye changes laterally and vertically, the front and backs of the eye present different potentials to electrodes placed either side of them.
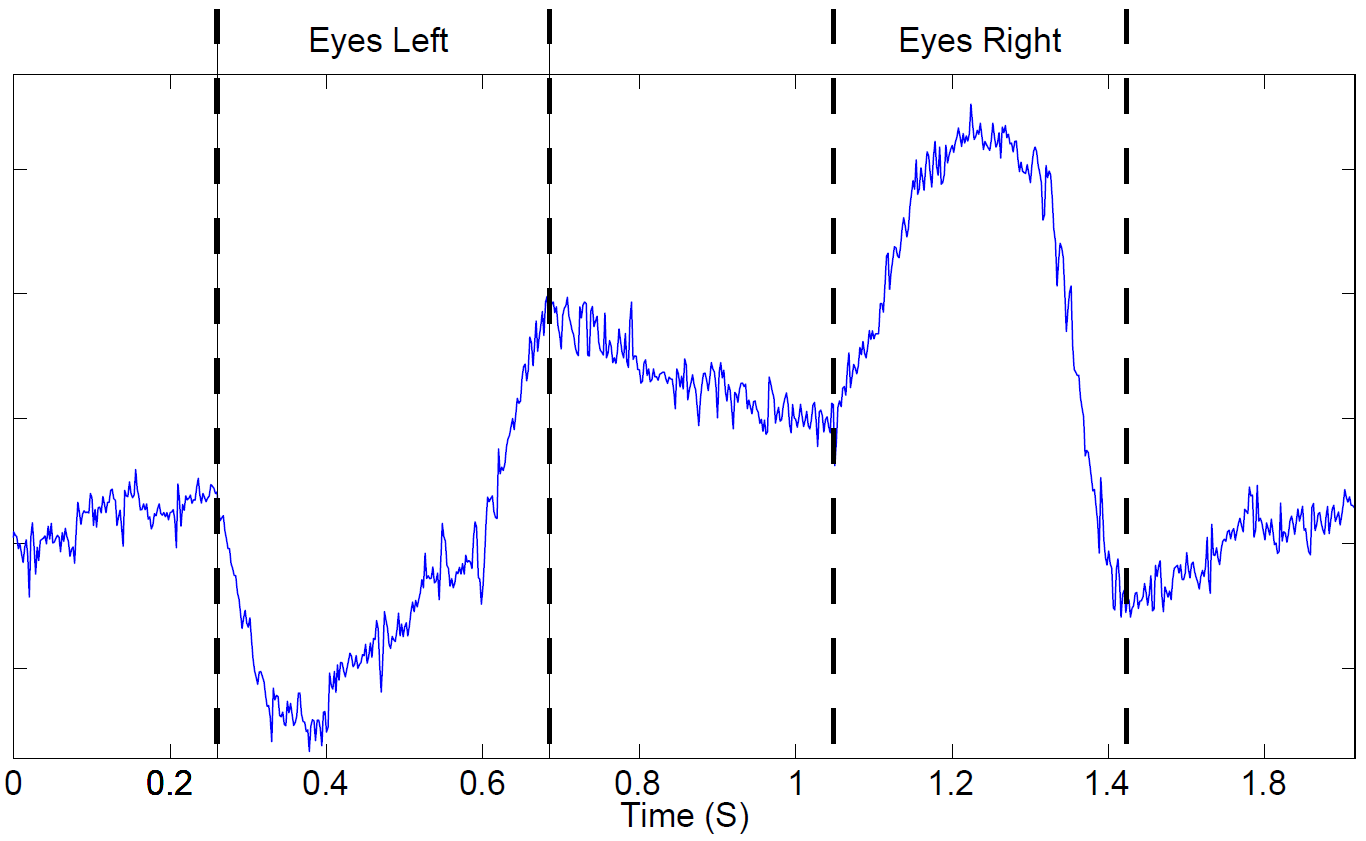
When the eyes move left, electrodes on the left of the head will be presented with a positive potential and electrode on the right will be presented with a more negative potential. The effects of this process are shown diagrammatically above. Assuming consistency of the resting potential, the recorded signals can provide accurate estimates of eye position.
The image above shows a top down view of the generation of EOG there is also a change in potential when the eyes move vertically. This becomes evident due to the induced potential when blinking occurs. This is not due to muscular effects of the lids closing, but due to the Bell phenomenon, where the eyes move vertically upward when closed.
Electroencephalography (EEG) is the acquisition of signals from the surface of the head that correspond to the temporally similar activations of large groups of neurons from the cerebral cortex. Many methods exist for the elicitation of specific EEG responses.
Electrical potentials associated with each neuron exist due to differential concentrations of ions outside and inside the neuronal cell. This potential is primarily regulated by the transportation of Sodium Na+ and Potassium K+ ions drawn in and expelled from the cell. Chloride Cl+ anions are also involved in the generation of certain action potentials such as Cardiac and Muscular.
The potential of a typical neuronal cell, when in resting state (i.e. not firing or stimulated) with reference to the surrounding extracellular medium, is approximately -60mV to -70mV. This is commonly referred to as the resting potential.
If the summation of the post-synaptic potentials generated in the neuronal cell by excitatory synapses outweighs that of inhibitory post-synaptic potentials, and is sufficient to raise the potential of the cell to approximately -55mV or more, an action-potential is initiated. At this occurrence the cell depolarises.
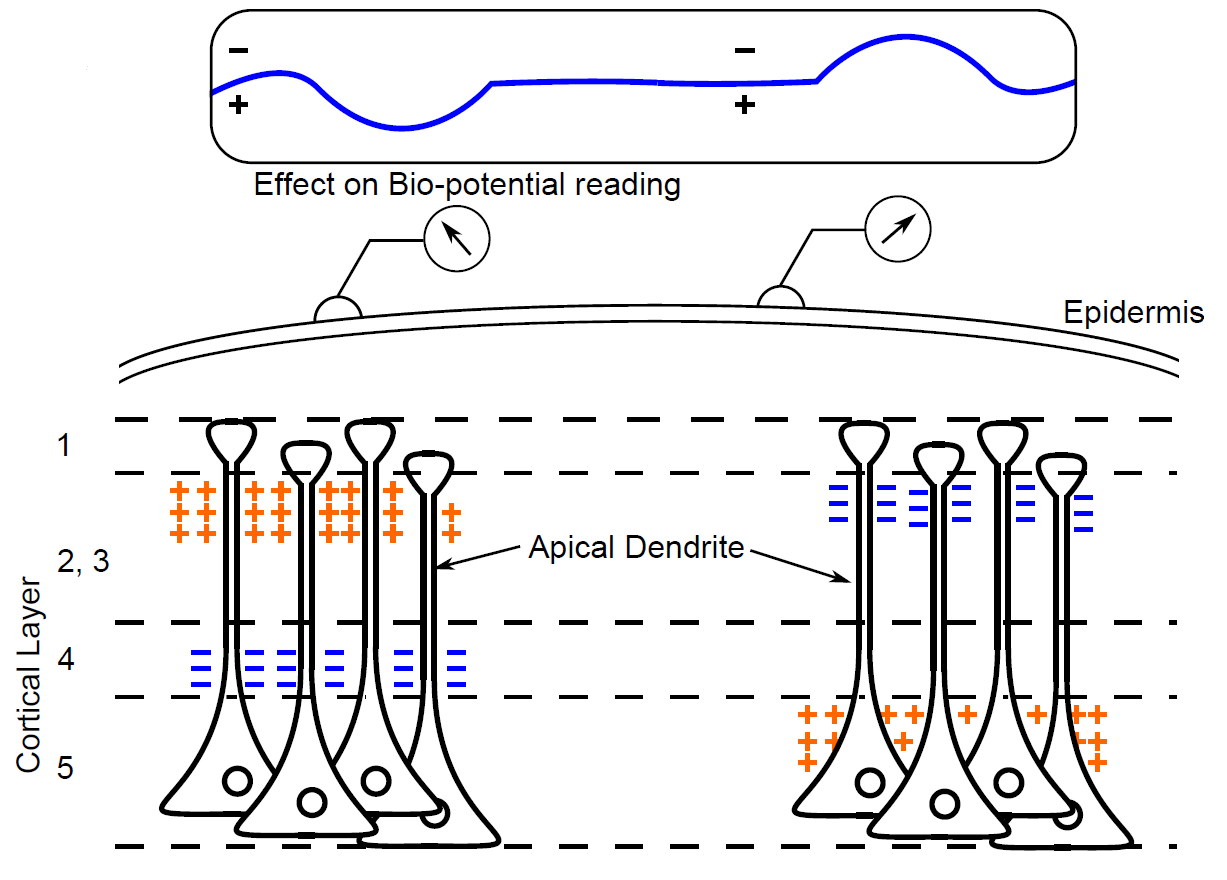
It is widely agreed that the potentials observed through the use of EEG measuring techniques are the result of extracellular current flow through synaptic terminals. This is a result of the electrical dipoles that exist between the soma and apical dendrites of pyramidal cells.
Inhibitory Post-Synaptic Potentials and Excitatory Post-Synaptic Potentials (IPSP and EPSP respectively) create these dipoles in varying ways. When excitation takes place at an apical dendrite, positive sodium ions accumulate within the cell body. This will be compensated by negative ions in the extracellular space resulting in a negative environment within this area. These negative ions are present in the extracellular media which leaves the space around the soma positive due to the ionic flow. Conversely, if an excitatory synapse connects to the pyramidal cells near the soma, the opposite occurs and the resultant dipole has an opposite direction.
However, if an inhibition occurs, the opposite may be said: negative ions flow into the cell or positive ions leave the cell and the dipole again reverses polarity.
Therefore, positive potentials result on the surface when an inhibition takes place in higher cortex layers, or an excitation takes place in deeper cortex layers, and vice versa. This is illustrated above. Two electrodes placed on the scalp will detect a positive or negative deflection based on potentials in the underlying tissue.
An old quote attributed to anonymous which has stayed with me:
Creating beauty enlightens the soul.
Creating humour increases joy.
Creating horror conjures sleeping demons.
Creating pathos builds compassion.
Creating innovation hastens the future.
Pure creation expands the emotions and makes us more than we are.
-Anon